DevSelfTrace

A Self-Annotation Tool for Understanding Programming Behavior

1North Carolina State University   2University of Oklahoma   3University of Alberta

The online demo autosaves annotations in your browser. Click Export JSON when finished to download your annotation file.

Abstract

Understanding programming behavior in modern software development is increasingly important with the rise of artificial intelligence (AI). Despite this increased importance, researchers lack tools to capture the complex, often invisible cognitive shifts in developer programming behavior. To address this gap, we present DevSelfTrace, a general-purpose annotation tool that enables developers to retrospectively annotate their programming behavior across four key dimensions: intention, action, supporting tool, and emotion. DevSelfTrace supports flexible time segmentation, customizable labels, and exports structured logs in JSON format.

DevSelfTrace has been used by 84 developers across multiple rounds of a mixed-methods user study investigating developer-AI interaction, where the collected annotation data directly supported the behavioral analysis reported in that study. A dedicated tool evaluation survey (N=33) indicates that 66.7% of developers found DevSelfTrace easy to use, and 87.9% agreed that it could support research or education on programming behavior.
Tool Overview

DevSelfTrace is a lightweight, browser-based annotation tool that lets developers retrospectively self-annotate a screen recording of a programming session. The participant divides the recording into self-defined time intervals and annotates each interval across four dimensions, grounded in the S-IASE model from our FSE'26 paper.

Intention
What the developer is trying to achieve (e.g., To Resolve Errors).
Action
The observable activity (e.g., Writing New Code, Crafting Query/Prompt).
Supporting Tool
The tool used (e.g., AI Tools, IDE, Search Engine).
Emotion
The affective state on a 7-point valence scale.
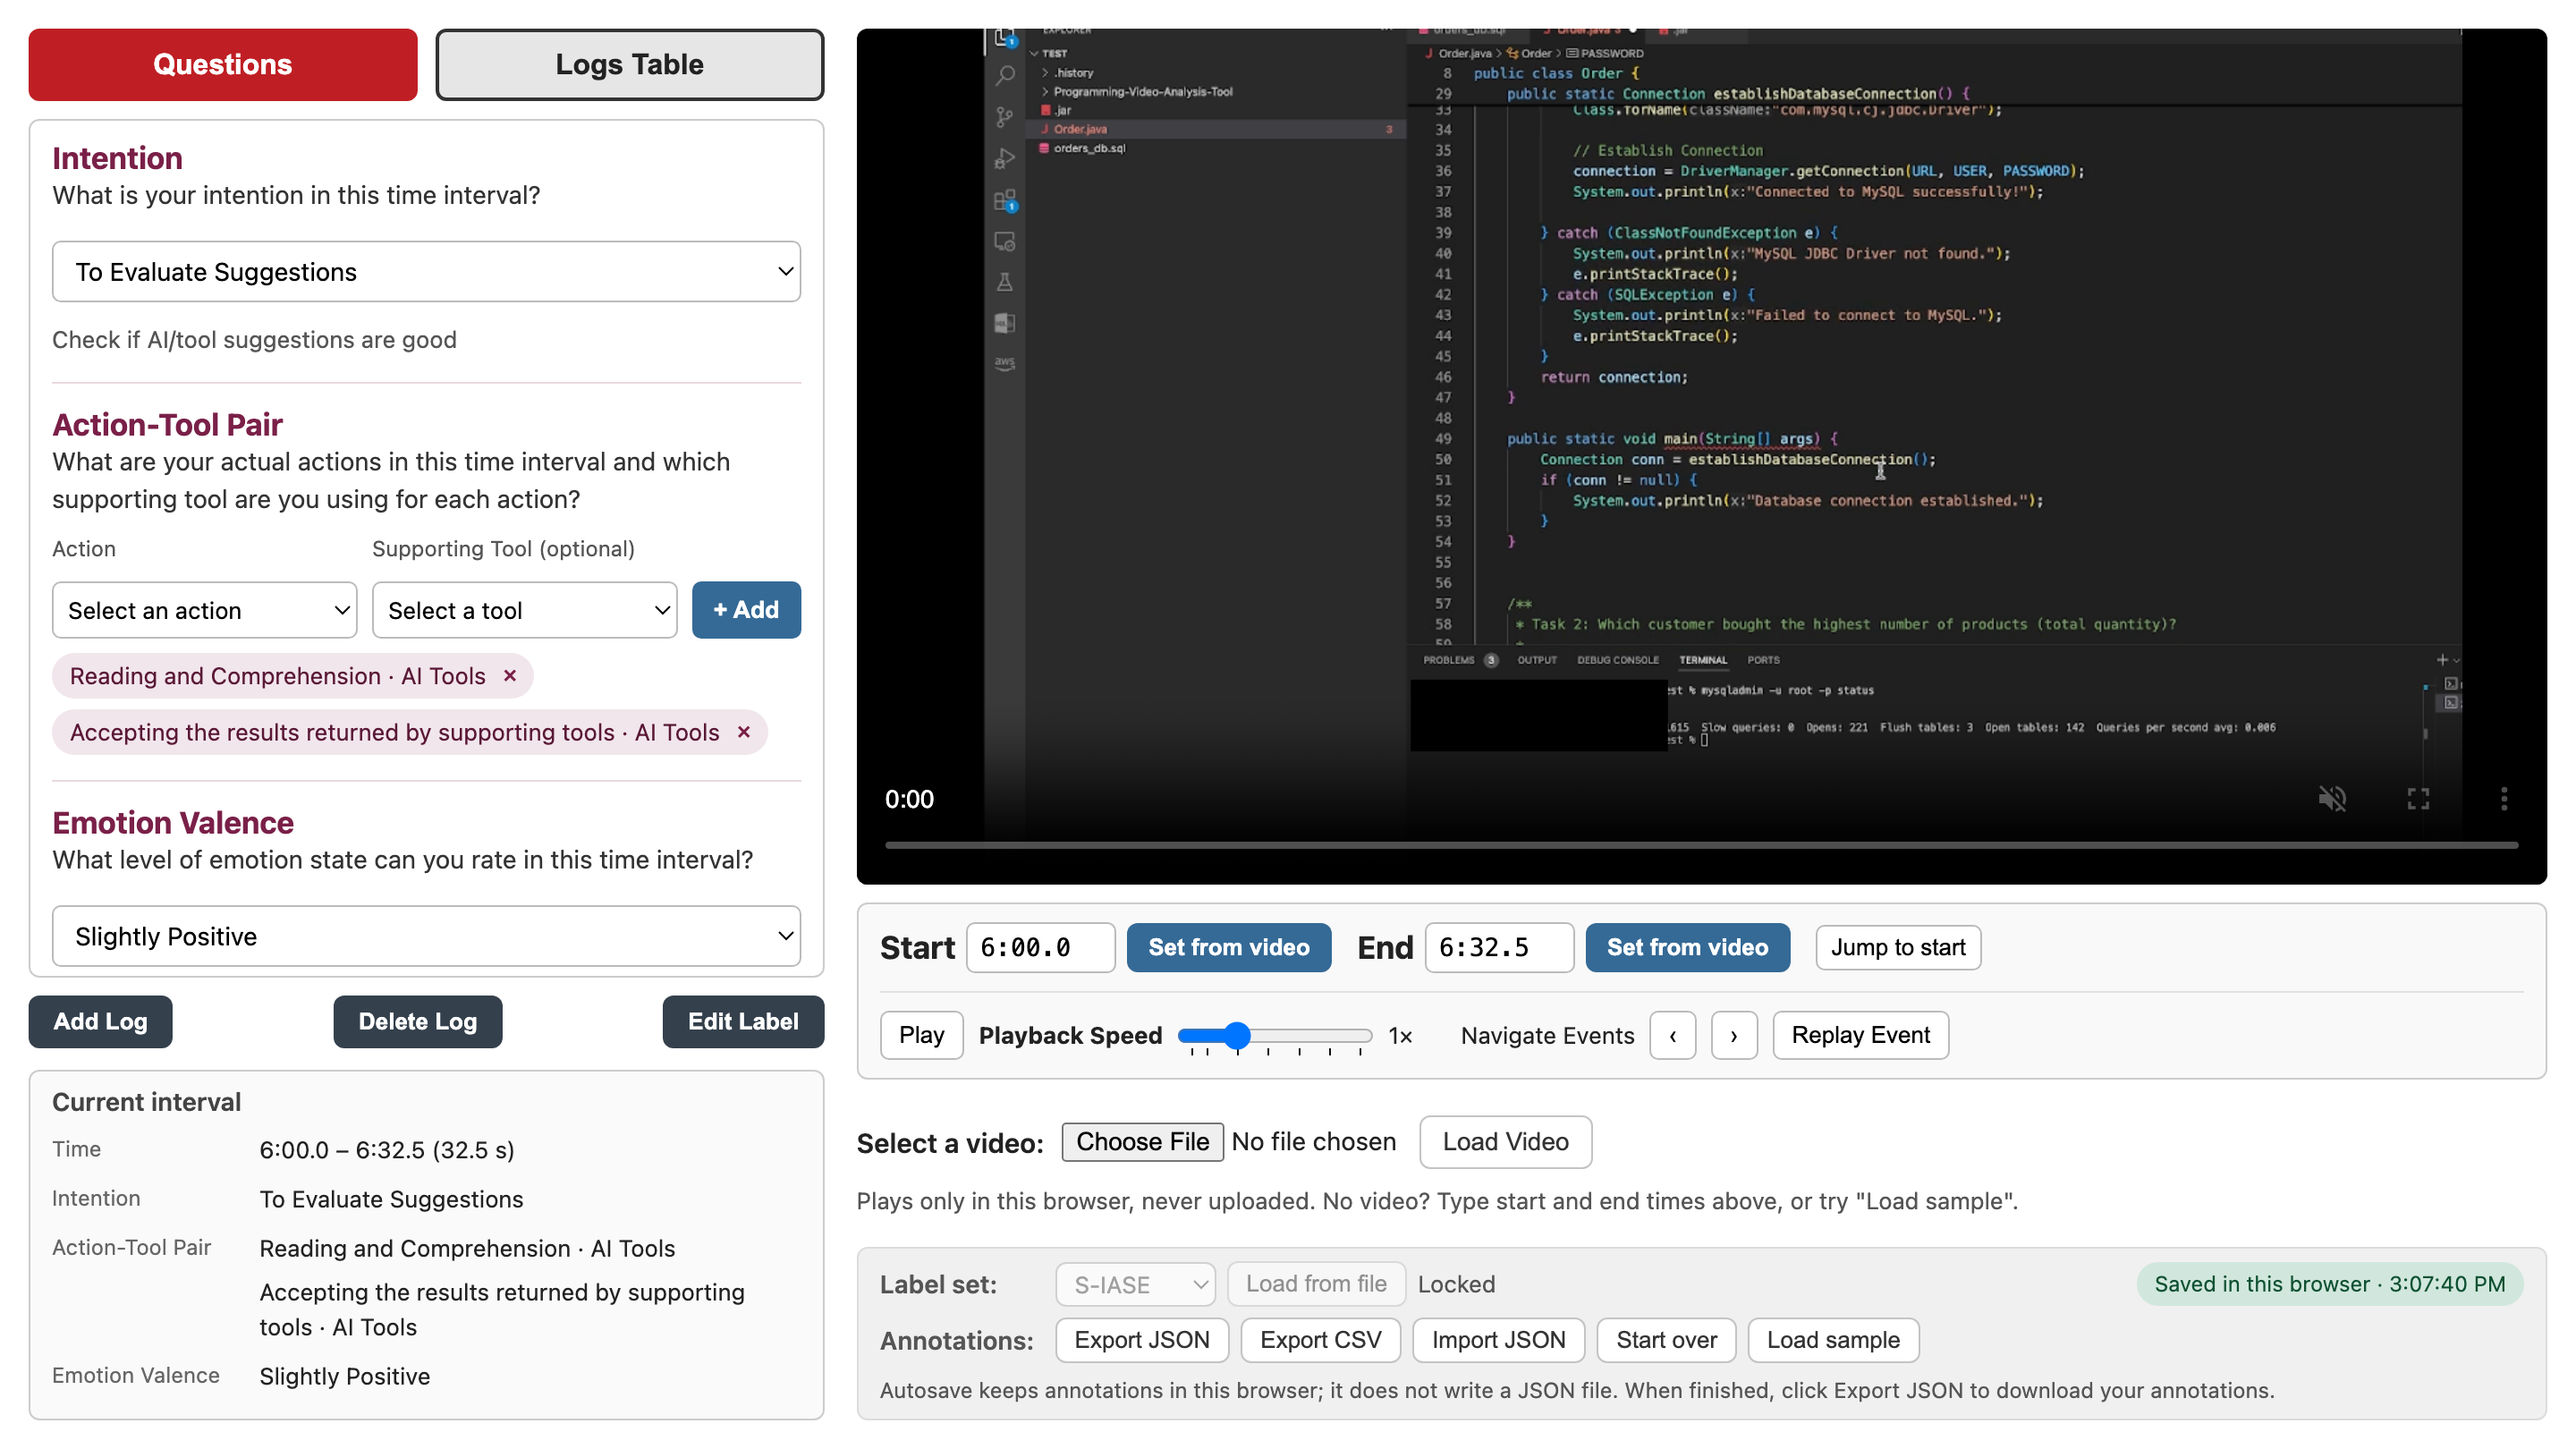
DevSelfTrace tool overview

Figure 1. DevSelfTrace interface with the default S-IASE label set. Left: the questions for the interval being annotated (here with the made-up sample session loaded). Right: the participant's screen recording, the interval's start and end with the playback controls, and below them the label set, the annotation buttons (export, import, start over, sample), and the save status.

Workflow

1 Upload a recording & set a time interval

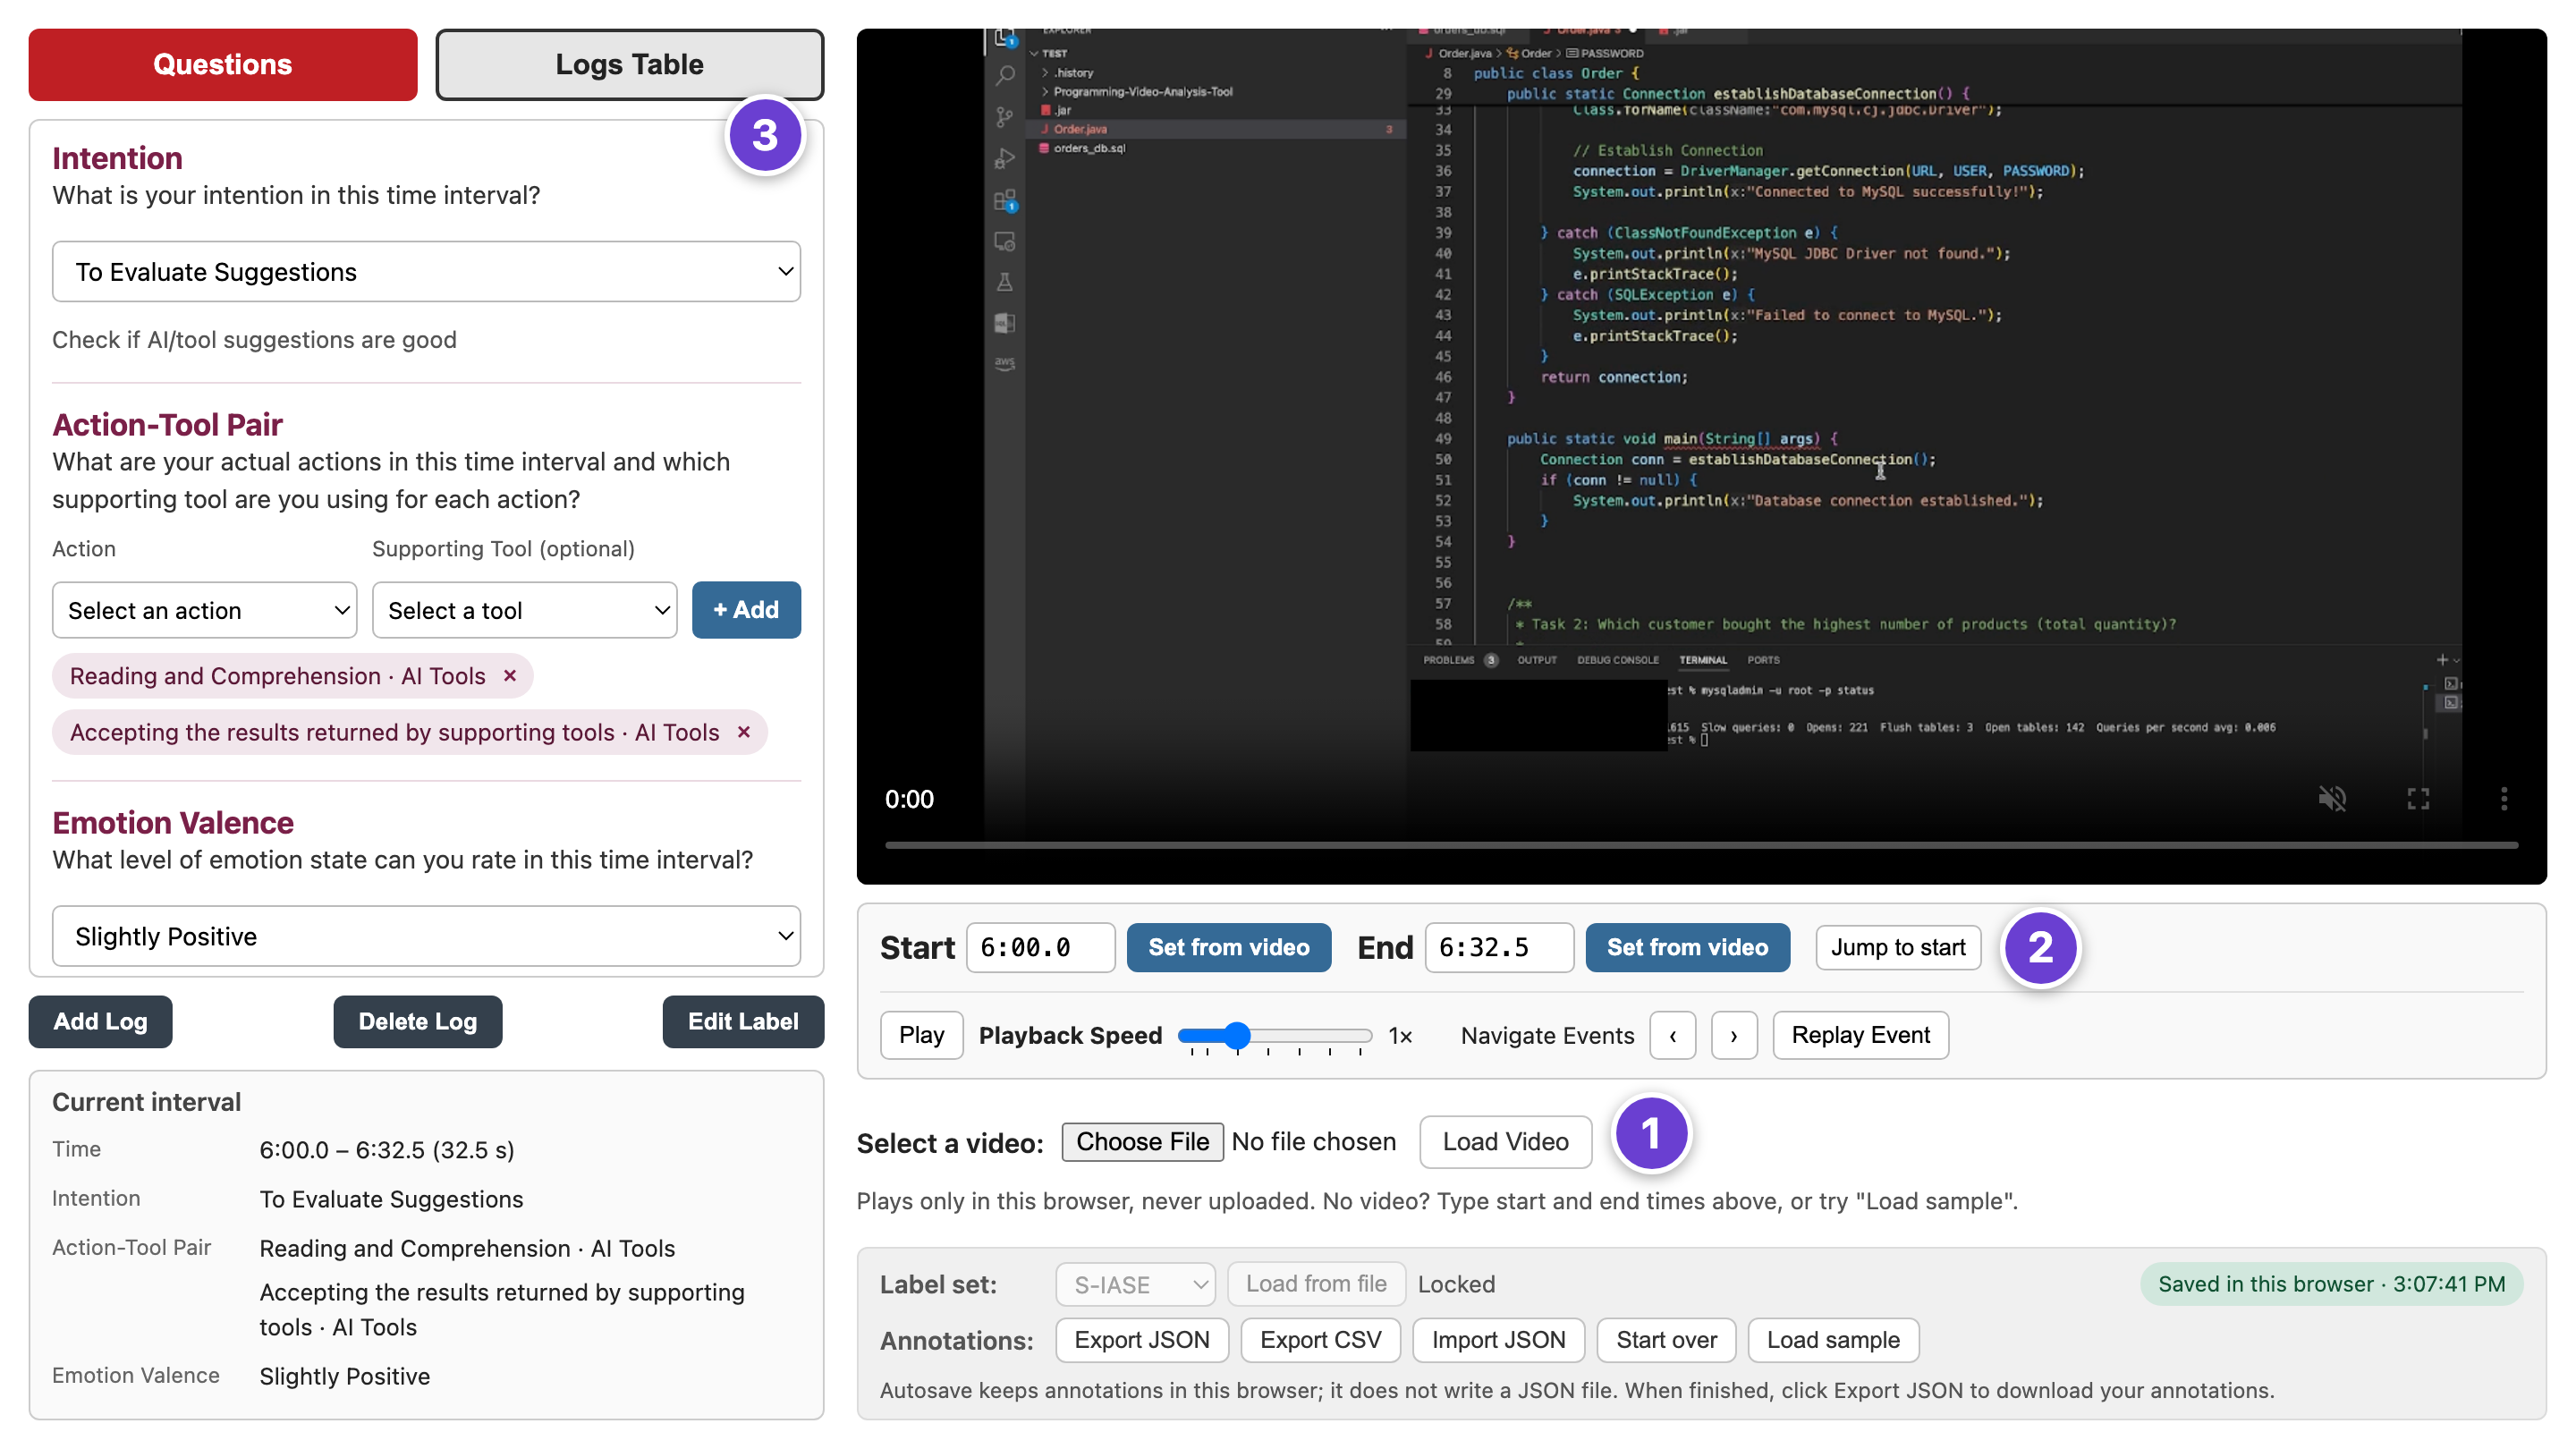
Participants load the screen recording of their programming session (MP4 or WebM; it plays only in their browser and is never uploaded). Using the built-in player, they move to a moment of interest and set the interval's start and end from the video, or type the times. The next interval starts where the previous one ended.

Uploading a recording and setting a time interval

Figure 2. The participant loads a screen recording (1), sets the start and end time of an interval (2), and annotates the interval across the dimensions of the label set (3).

2 Annotate with guided menus

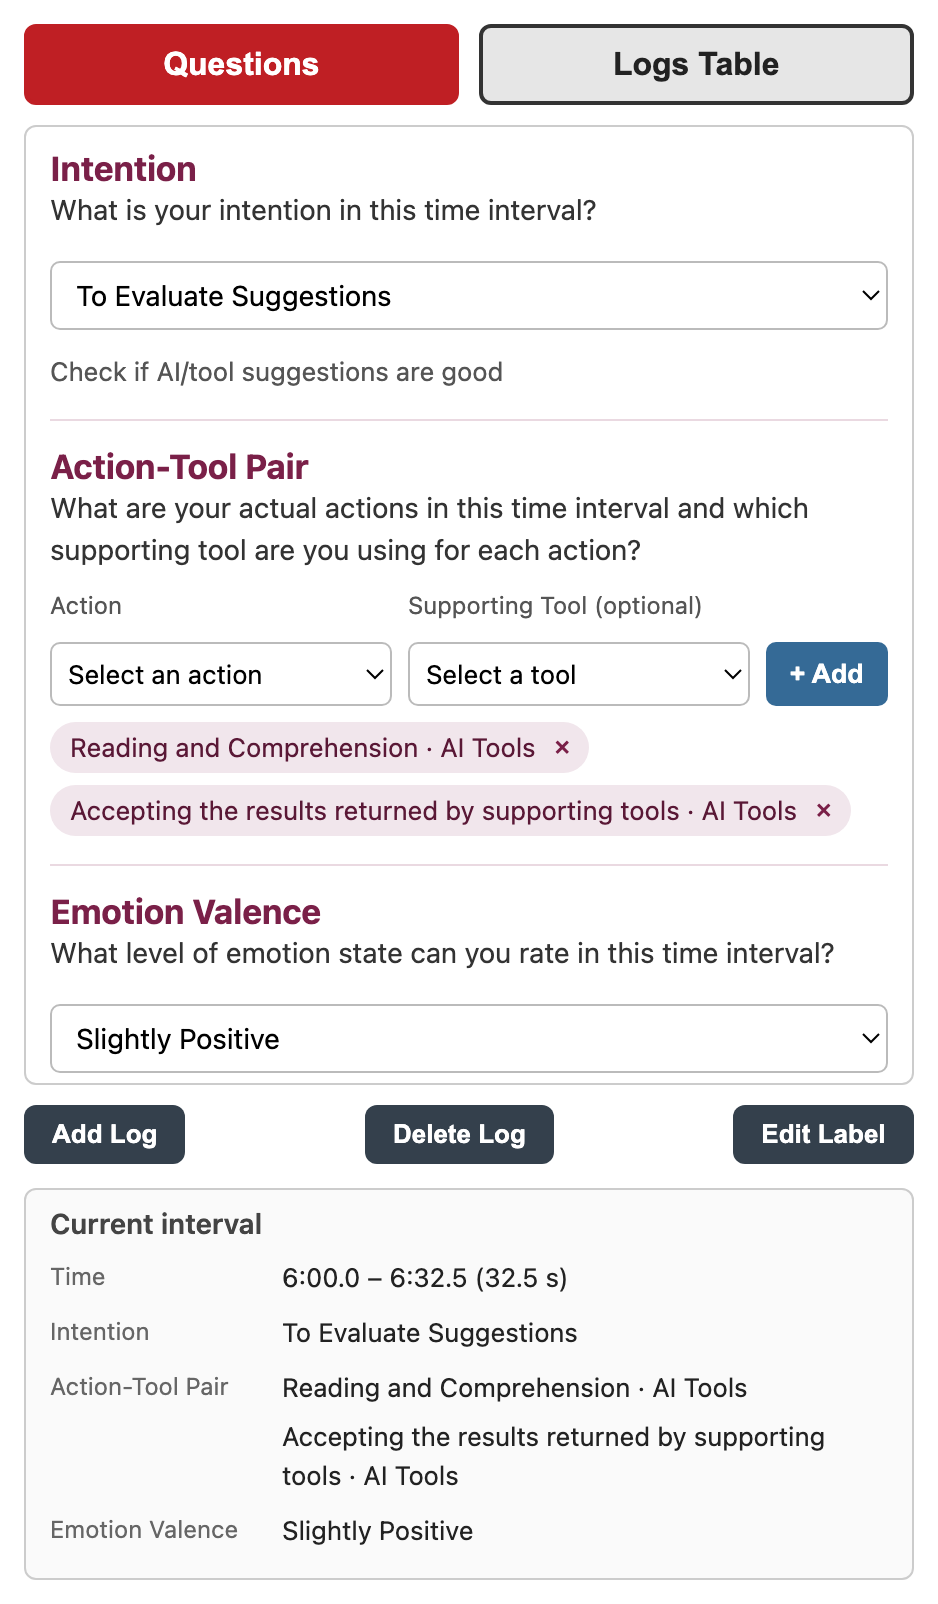
Each dimension offers predefined options and, through Other, custom labels. Because intention is more abstract than the other dimensions, the chosen intention's short definition is shown under the menu (e.g., To Evaluate Suggestions → "Check if AI/tool suggestions are good"). Actions and their supporting tools are added as pairs, shown as chips that can be removed. "Add Log" stays disabled until the interval is complete, and the summary says what is still missing.

Questions for one interval: intention with its definition, action-tool pairs as chips, emotion valence

Figure 3. Annotating one interval: the chosen intention's definition below the menu, two action–tool pairs as chips, and the emotion valence, with a summary of the interval underneath.

3 Review & export structured data

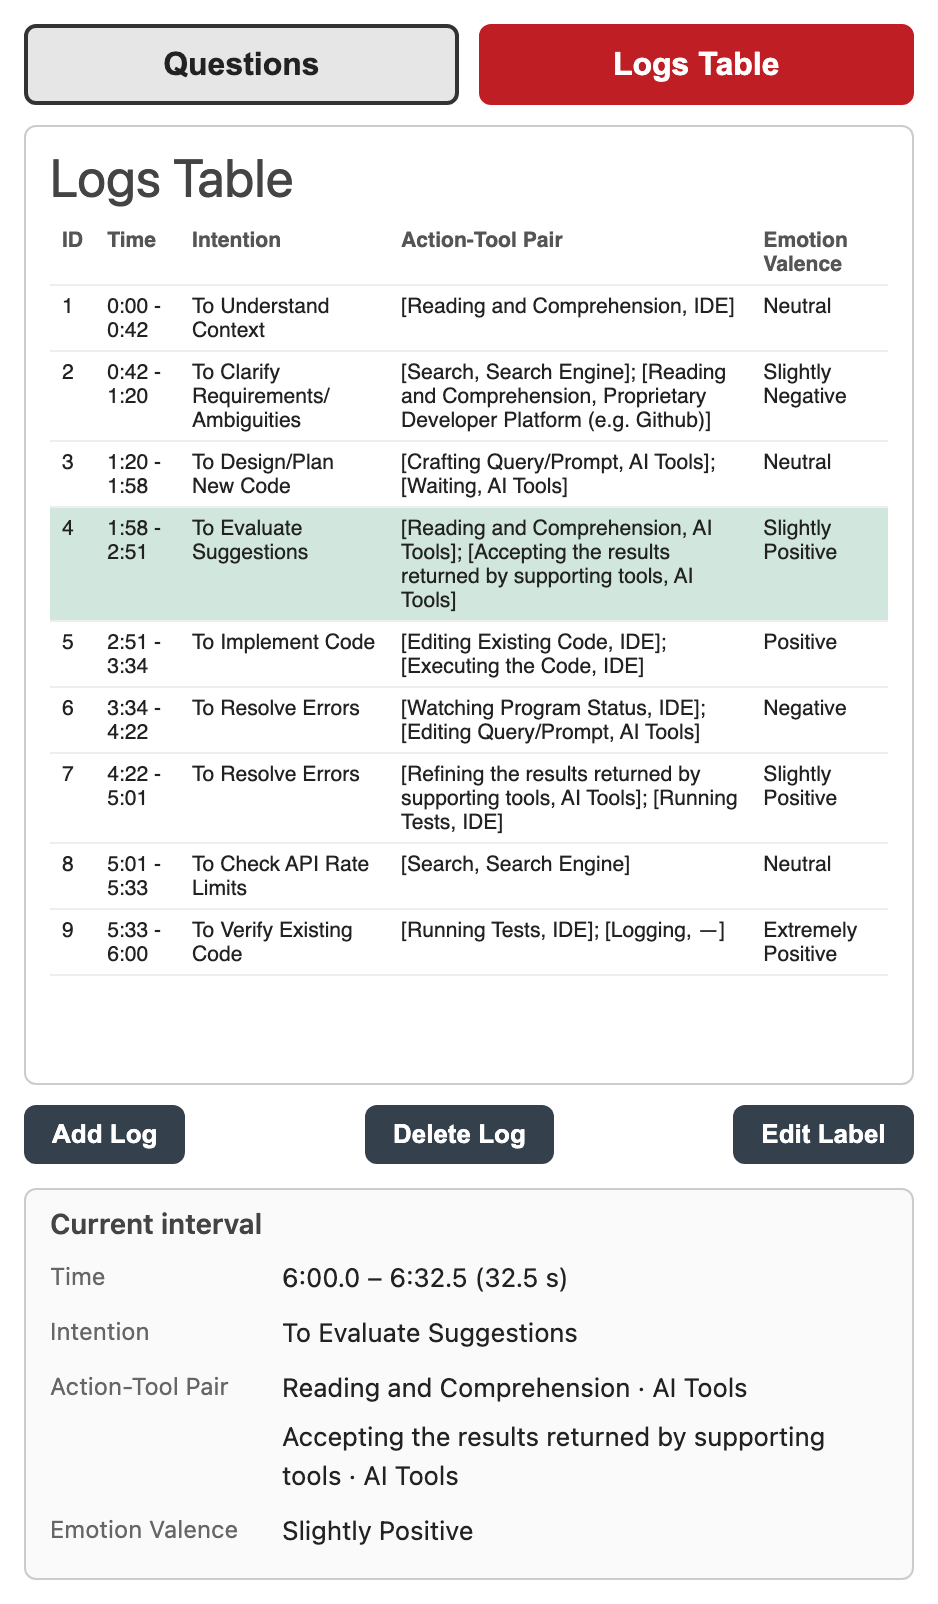
A live log table shows every annotated interval; participants select a row to replay, edit, or delete it. In the online and offline HTML versions, annotations are autosaved in the current browser; no JSON file is created or updated automatically. Participants click Export JSON to download their annotations for submission or later import, or Export CSV for analysis. With the annotation server or Docker, autosave writes directly to the configured JSON file. The exported data supports sequence mining, co-occurrence modeling, or qualitative coding.

Logs table showing all annotated intervals

Figure 4. Logs table with all annotated intervals of the sample session; the selected row can be replayed, edited, or deleted.

An example of a single annotated interval in the exported JSON (times in seconds; one key per dimension of the label set):

{
  "id": 3,
  "start": 153.2,
  "end": 191.45,
  "duration": 38.25,
  "intention": "To Design/Plan New Code",
  "actions": [
    { "action": "Crafting Query/Prompt", "tool": "AI Tools" },
    { "action": "Reading and Comprehension", "tool": null }
  ],
  "emotion": "Slightly Positive"
}

Evaluation Highlights

84
developers used DevSelfTrace across pilot & main study
N=33
independent tool-evaluation survey responses
66.7%
found the tool easy to use
87.9%
agreed it could support research or education on programming behavior

The annotation data collected through DevSelfTrace directly supported the behavioral analysis in our FSE'26 paper, including sequential pattern mining (CloSpan), aggregated behavioral comparisons, and thematic analysis — demonstrating that the tool produces research-quality data.

Survey results (earlier version)

An anonymous, optional survey was sent to all 84 participants of the FSE'26 study (8 in the pilot study, 76 in the main study); 33 responded (39.3%). They rated the version of DevSelfTrace used in that study on a 5-point Likert scale. Values are percentages of the 33 responses.

StatementStrongly agreeAgreeNeutralDisagreeStrongly disagree
Usability
I thought this annotation tool was easy to use24.242.427.36.10.0
I consider my interactions with the annotation tool to be understandable and clear24.260.69.16.10.0
I can easily use the tool with the provided usage demo by organizers before I started to annotate15.257.627.30.00.0
I would imagine that most people would learn to use this annotation tool very quickly15.248.518.218.20.0
I felt very confident in using this annotation tool24.254.521.20.00.0
Usefulness
The multiple input fields (e.g., three input boxes) capture my thoughts (e.g., intentions and emotions) and actions effectively12.157.618.29.13.0
The dropdown menus cover a comprehensive set of actions and reduce typing errors12.160.621.26.10.0
The custom input option is useful for describing unique actions39.451.59.10.00.0
The annotation process helped me become more aware of my programming intentions and decisions18.260.618.23.00.0
I believe this tool could be useful for researchers or educators who study programming behavior analysis18.269.76.16.10.0

Citation

If you use DevSelfTrace in your research, please cite the underlying behavioral study (the S-IASE model originated here):

@inproceedings{wu2026developers,
  title     = {How Do Developers Interact with AI? An Exploratory Study on
               Modeling Developer Programming Behavior},
  author    = {Wu, Yinan and Li, Ze Shi and Stolee, Kathryn Thomasset and Xu, Bowen},
  booktitle = {Proceedings of the ACM International Conference on the
               Foundations of Software Engineering (FSE)},
  year      = {2026},
  doi       = {10.1145/3808120}
}

A separate tool paper describing DevSelfTrace is in preparation. The arXiv preprint and full BibTeX entry will be added here once available.